

一、使用场景描述
Prometheus Pushgateway 是一个中间代理服务,它提供了一种推送指标数据到 Prometheus 的方式。通常,Prometheus 是一个拉取模型的监控系统,通过定期轮询各个目标来获取指标数据。然而,有些场景下,由于不在一个网络或者防火墙的问题,导致prometheus 无法拉取各个节点的数据。那么我们就可以使用Pushgateway。
Pushgateway 应该被视为一种临时的解决方案,因为它引入了一些复杂性和潜在的问题,例如数据的一致性和重复推送等。
二、Pushgateway部署
1、下载执行包
mkdir -p /opt/soft/ && cd $_

export gatewayVer="1.6.2"

wget https://github.com/prometheus/pushgateway/releases/download/v${gatewayVer}/pushgateway-${gatewayVer}.linux-amd64.tar.gz


# 国内github代理下载
wget https://gh-proxy.com/https://github.com/prometheus/pushgateway/releases/download/v${gatewayVer}/pushgateway-${gatewayVer}.linux-amd64.tar.gz

# 重命名
mv /usr/local/pushgateway-${gatewayVer}.linux-amd64 /usr/local/pushgateway
2、启动服务程序
cat > /etc/systemd/system/pushgateway.service <<\EOF
[Unit]
Description=Prometheus Pushgateway
After=network.target

[Service]
ExecStart=/usr/local/pushgateway/pushgateway --web.listen-address=0.0.0.0:9091
Restart=always

[Install]
WantedBy=default.target
EOF


systemctl daemon-reload
systemctl start pushgateway.service
systemctl status pushgateway.service
systemctl enable pushgateway.service
3、接入Prometheus
vim /usr/local/prometheus/prometheus.yml
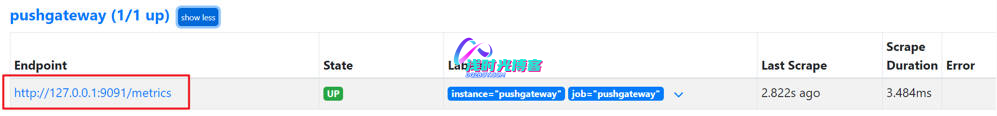
- job_name: "pushgateway"
honor_labels: true
static_configs:
- targets: ['127.0.0.1:9091']
labels:
instance: pushgateway
参数说明:
honor_labels:true 表示 Prometheus 会在发送请求给 scrape_configs 中定义的 targets 时,尊重这些 targets 自身的标签配置。这是为了确保从不同的 job 或 targets 中采集的指标数据能够正确地区分和显示
# 重载Prometheus配置
curl -X POST http://127.0.0.1:9090/-/reload
4、Push数据到PushGateway
接下来,我们要 Push 数据到 PushGateway 中,可以通过其提供的 API 标准接口来添加,默认 URL 地址为:http://<ip>:9091/metrics/job/<JOBNAME>{/<LABEL_NAME>/<LABEL_VALUE>},其中 <JOBNAME> 是必填项,为 job 标签值,后边可以跟任意数量的标签对,一般我们会添加一个 instance/<INSTANCE_NAME> 实例名称标签,来方便区分各个指标。
4.1:编写数据收集脚本
mkdir -p /script/ && cd $_

# 编写数据推送脚本
vi node_export_push.sh
#!/usr/bin/env bash
# 设置 Pushgateway 的地址和端口
PUSHGATEWAY_ADDRESS="<pushgateway-address>"
PUSHGATEWAY_PORT="<pushgateway-port>"
JOB_NAME="<job-name>"
INSTANCE_NAME=$(hostname -I | awk '{print $1}')

# 收集 node_exporter 的指标数据
METRICS=$(curl -s http://localhost:9100/metrics)

# 推送指标数据到 Pushgateway
echo "$METRICS" | curl --data-binary @- http://${PUSHGATEWAY_ADDRESS}:${PUSHGATEWAY_PORT}/metrics/job/${JOB_NAME}/instance/${INSTANCE_NAME}


# 给脚本添加执行权限
chmod +x node_export_push.sh
4.2:测试数据收集情况
- 执行脚本,浏览器查看
http://pushgateway_IP:9091,确认数据是否上报上去
./node_export_push.sh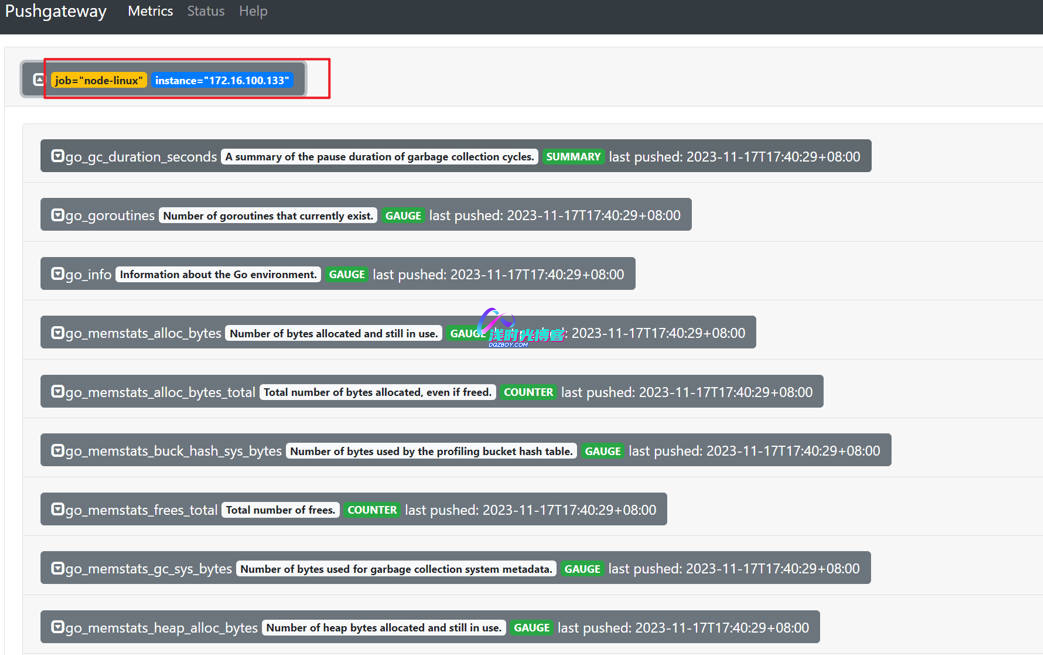
4.3:设置添加定时任务
确认数据上传上去了,我们就可以配置定时任务,进行定时数据上报了
# crontab -e

*/5 * * * * /bin/bash /script/node_export_push.sh
必须 注册 为本站用户, 登录 后才可以发表评论!